Raster Data Analysis With Spatial SQL And Apache Sedona
One of the strengths of Apache Sedona and Wherobots Cloud is the ability to work with large scale vector and raster geospatial data together using Spatial SQL. In this post we’ll take a look at how to get started working with raster data in Sedona using Spatial SQL and some of the use cases for […]
TABLE OF CONTENTS
Contributors
-
William Lyon
Developer Relations At Wherobots
One of the strengths of Apache Sedona and Wherobots Cloud is the ability to work with large scale vector and raster geospatial data together using Spatial SQL. In this post we’ll take a look at how to get started working with raster data in Sedona using Spatial SQL and some of the use cases for raster data analysis including vector / raster join operations, zonal statistics, and using raster map algebra.
Raster Data Overview
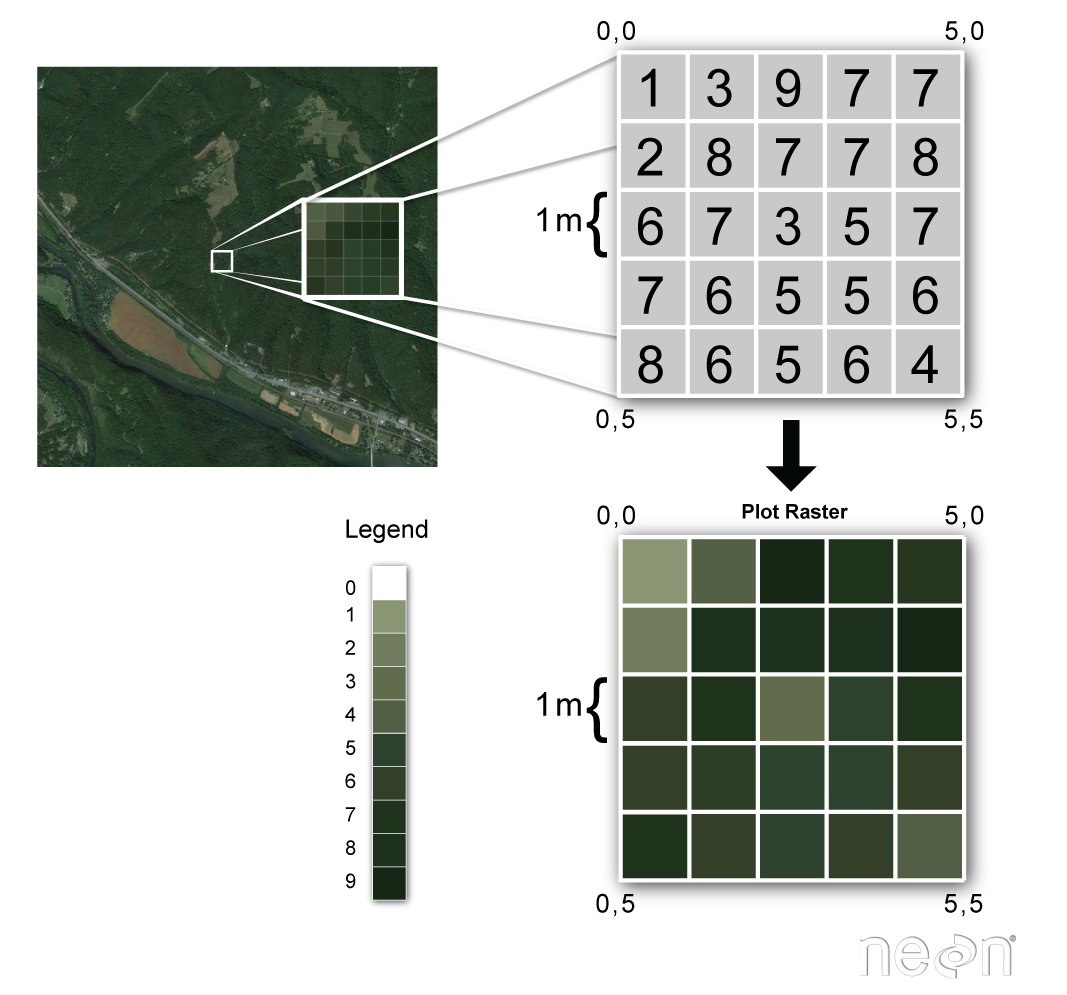
Raster data refers to gridded data where each pixel has one or more values associated with it (called bands) and each pixel references a geographic location. Common raster data include aerial imagery, elevation models, precipitation maps, and population distribution datasets.
This image from the National Ecological Observatory Network (NEON) does a great job of introducing raster data concepts using an example of aerial imagery. We can see the value of each pixel, the coordinates of each pixel in pixel space, and how pixel values map to the color rendered when the raster is visualized. We also see the spatial resolution of the data as measured by the height of each pixel, in this case 1 meter. This means that each pixel represents 1 square meter of the Earth’s surface.
When working with raster data in Sedona we store rasters and their associated metadata as rows in a table and query them using Spatial SQL. Additionally, large rasters can be tiled so that each row in the table represents a single tile of a larger raster image.
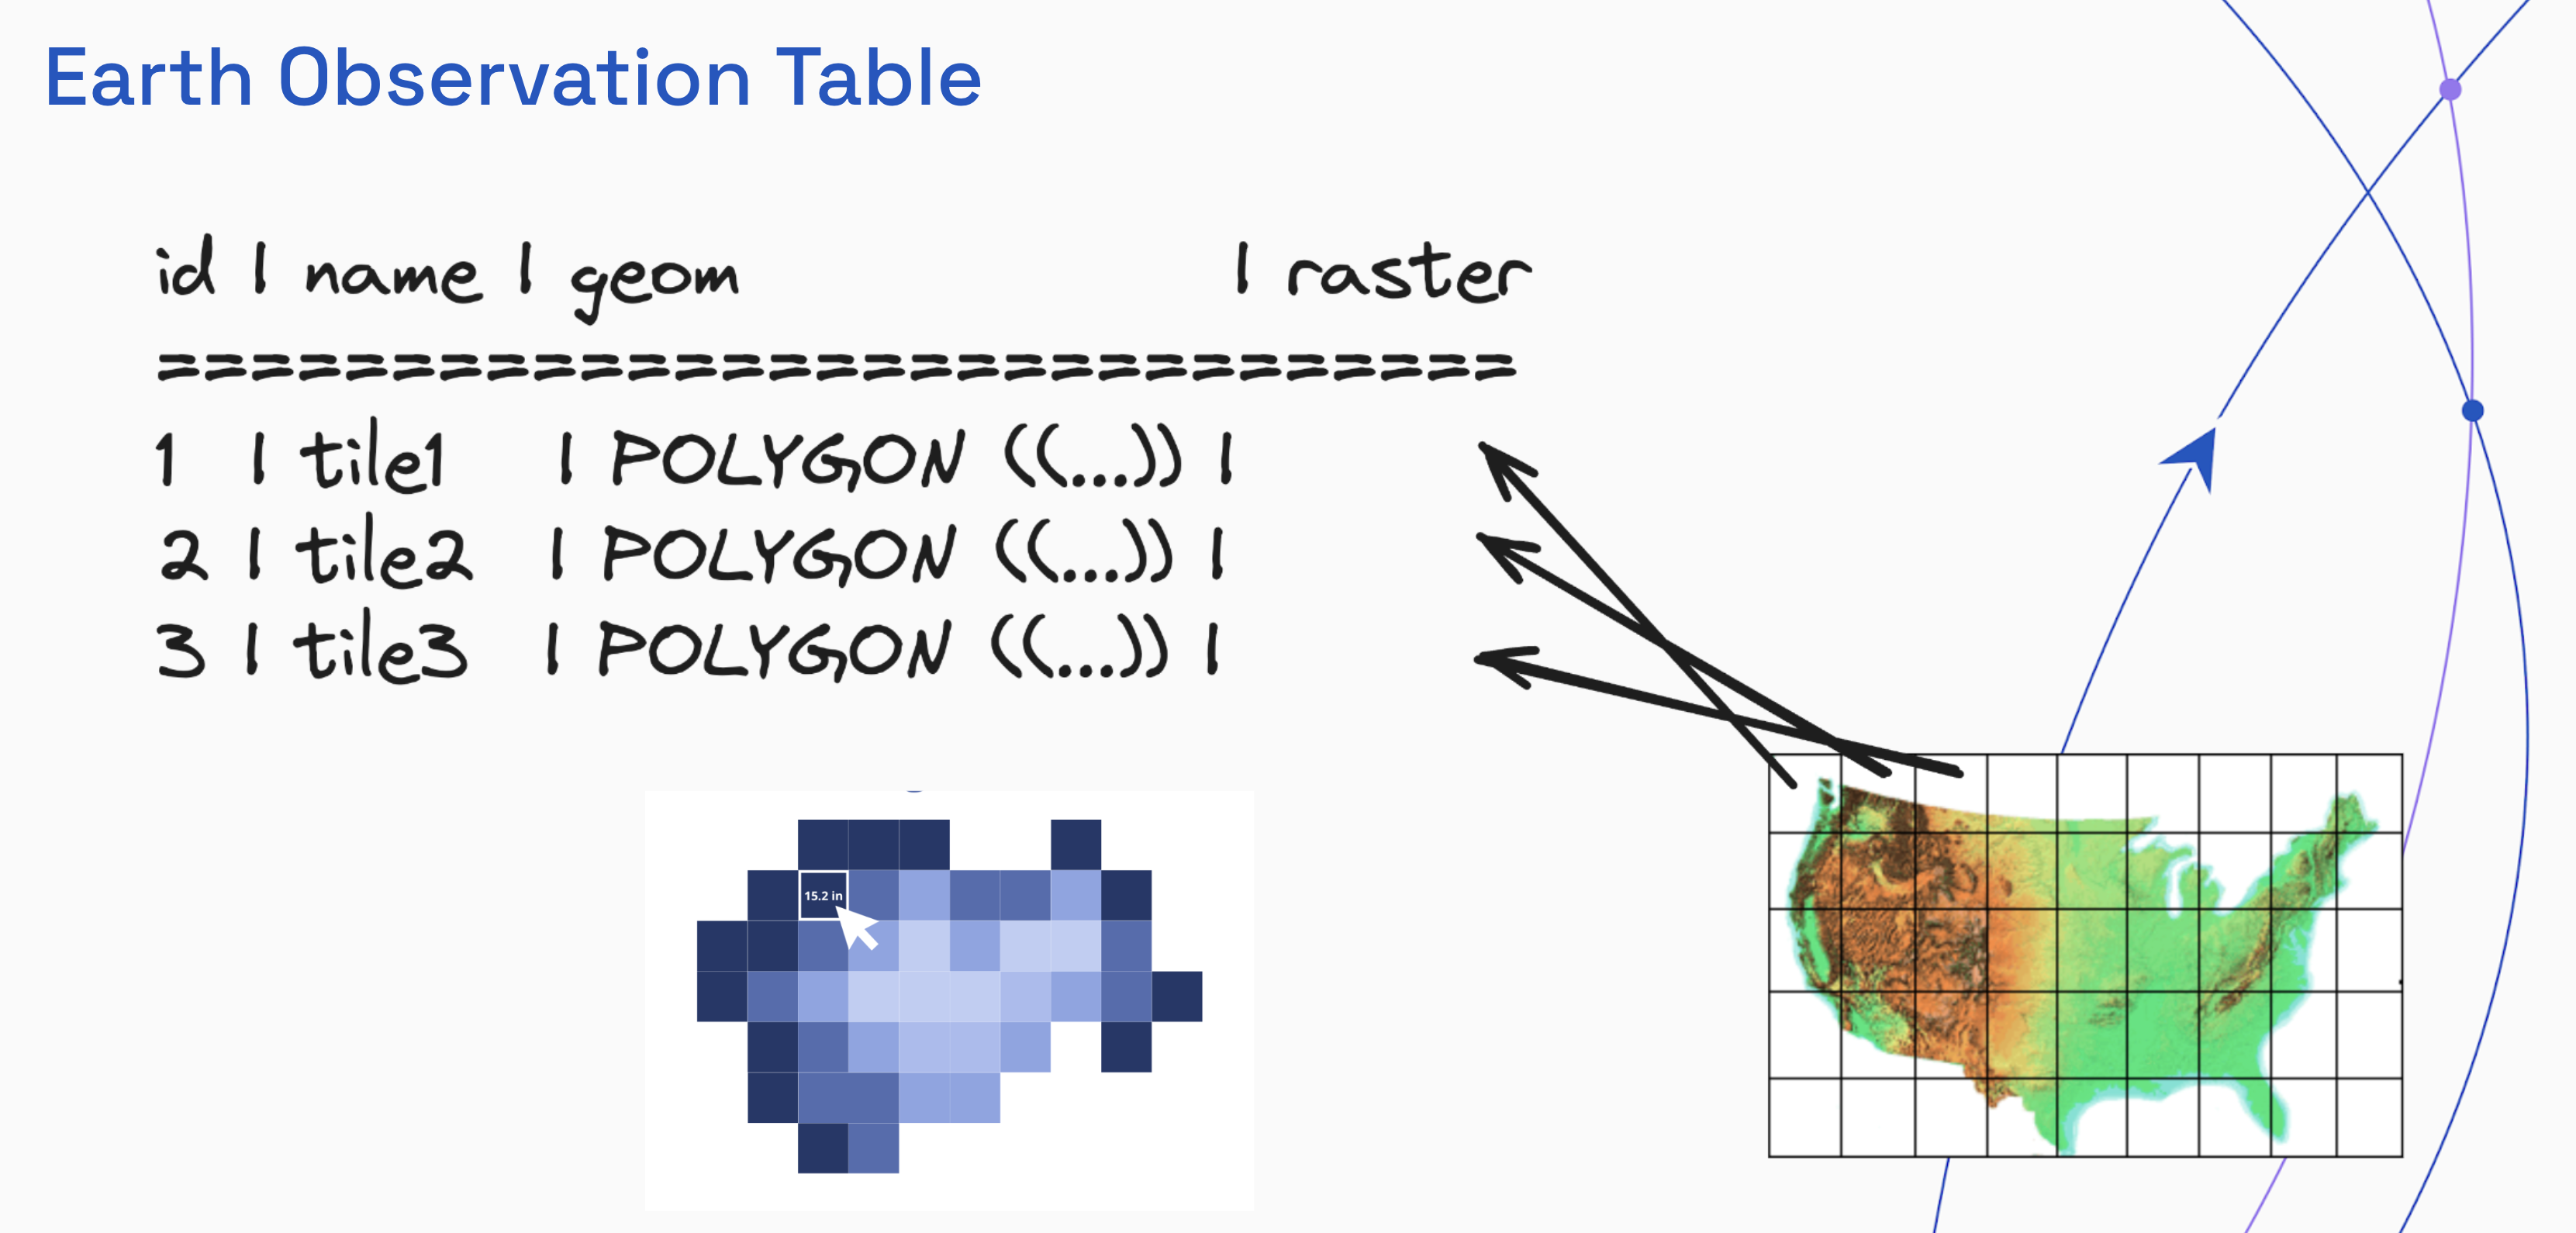
One of the tools available to us when analyzing raster data is map algebra: performing calculations using the individual pixel values. We can perform map algebra operations across multiple bands in a single raster (useful when computing indexes like NDVI) and also map algebra operations across different rasters (useful for time series analysis).

There are several map algebra operations available using Spatial SQL, but in the image above we can see the RS_MapAlgebra function being used to compute the difference in average surface temperature between two years.
Let’s see some examples of how to get started working with raster data in Sedona. If you’d like to follow along you can create a free Wherobots Cloud account and get started today.
Load A Single Raster
Let’s start with a simple example of loading a single GeoTiff from the NEON high resolution imagery dataset. We’ll then perform some basic map algebra operations on the image and introduce some new Spatial SQL functions along the way.
Sedona supports a number of raster data formats, including Arc/Info ASCII grid, NetCDF, and GeoTiff. See the raster loaders documentation page for more. Rasters can be loaded as "out-of-database" (out-db) rasters from a remote file path or "in-database" (in-db). Out-db allows for managing large raster datasets stored on cloud storage and enables efficient handling of remote data, while the in-db format is useful when the raster data needs to managed within the database because of data integrity or access efficiency requirements. In most cases we typically want to be using the out-db raster format.
We can use the RS_FromPath Spatial SQL function to create an out-db raster from a remote file path. I’ve loaded the example GeoTiff we’ll be using into a public S3 bucket, so when instantiating our SedonaContext we’ll need to configure anonymous access to this bucket.
config = SedonaContext.builder(). \
    config("spark.hadoop.fs.s3a.bucket.wherobots-examples.aws.credentials.provider","org.apache.hadoop.fs.s3a.AnonymousAWSCredentialsProvider"). \
    getOrCreate()

sedona = SedonaContext.create(config)
Next, we load the GeoTiff and create an out-db raster using RS_FromPath, specifying the S3 URI for the single GeoTiff.
file_url = "s3://wherobots-examples/data/examples/NEON_ortho.tif"
neon_df = sedona.sql(f"SELECT RS_FromPath('{file_url}') AS raster")
neon_df.createOrReplaceTempView("neon")
neon_df.printSchema()
We can see that our DataFrame has a single column raster which is of type raster .
root
 |-- raster: raster (nullable = true)
Once we’ve loaded a raster we can inspect the metadata using the RS_MetaData Spatial SQL function.
sedona.sql("SELECT RS_MetaData(raster) from neon").show(truncate=False)This function will return the upper left coordinates of the raster (in the raster’s coordinate system’s units), the width and height of the raster (in number of pixels), the spatial resolution of each pixel (in units of the rasters’s CRS), skew or rotation of the raster (if any), the SRID of the raster’s coordinate system, and the number of bands in the raster.
+------------------------------------------------------------------------+
|rs_metadata(raster)                                                     |
+------------------------------------------------------------------------+
|[470000.0, 7228000.0, 1000.0, 1000.0, 1.0, -1.0, 0.0, 0.0, 32606.0, 3.0]|
+------------------------------------------------------------------------+
Based on this output we can observe a few important details about the raster:
- the upper left coordinate is 470000, 7228000 in the raster’s CRS
- the raster is 1000 pixels by 1000 pixels
- each pixel represents 1 square meter which means the raster image represents 1 square kilometer (1000 pixels x 1 meter)
- the SRID is 32606, which is UTM zone 6N
- the raster has 3 bands, representing the red, green, and blue color spectrums
There are a number of other Spatial SQL functions that can be used to inspect similar metadata values, such as RS_NumBands
sedona.sql("SELECT RS_NumBands(raster) FROM neon").show()+-------------------+
|rs_numbands(raster)|
+-------------------+
| 3|
+-------------------+We can visualize the raster using the RS_AsImage function.
htmlDf = sedona.sql("SELECT RS_AsImage(raster, 500) FROM neon")
SedonaUtils.display_image(htmlDf)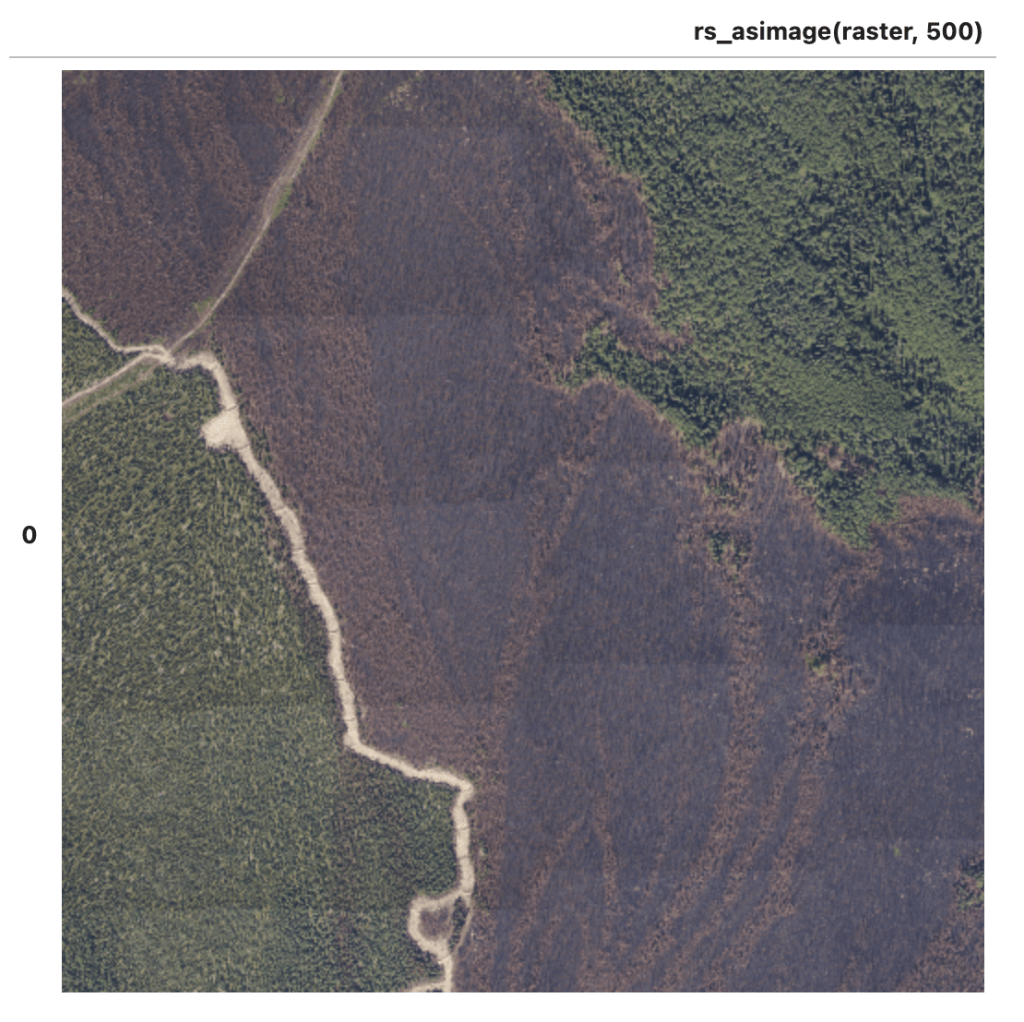
To obtain pixel values at specific coordinates we can use the RS_Value or RS_Values function. Note that for rasters with multiple bands we must specify which band we are interested in. We’ll also need to specify the SRID of our geometry (in this case a Point) to match that of the raster.
Here we retrieve the value of the upper left pixel for band 1, which represents the red color spectrum.
sedona.sql("""
SELECT RS_Value(raster, ST_SetSRID(ST_Point(470000, 7227880), 32606), 1)
AS pixel_value
FROM neon
""").show(truncate=False)
+-----------+
|pixel_value|
+-----------+
|127.0 |
+-----------+Map Algebra Operations
Performing raster math is one of the most common and powerful workflows when analyzing raster data. Sedona supports a number of band-specific raster math operations such as:
- RS_Add, RS_Divide, RS_Mean, RS_NormalizedDifference, etc
- RS_MapAlgebra
RS_MapAlgebra is used to apply a map algebra script on a raster or multiple rasters, for example to calculate NDVI (to identify vegetation) or AWEI (to identify bodies of water). Let’s calculate the Normalized Difference Greenness Index (NDGI) for our raster. NDGI is a metric similar to NDVI, however it can be computed using only visible spectrum (RGB) whereas NDVI uses near infrared as well.
For each pixel NDGI is calculated by dividing the difference of the green and red band values by the sum of the green and red band values, resulting in a value between -1 and 1. To interpret NDGI, values greater than zero are indicative of vegetation, while values less than zero are indicative of no-vegetation.

To calculate NDGI we will use the RS_MapAlgebra function which uses a map algebra scripting language called Jiffle to express the computation to be performed. Note that the result of this operation is a new raster with a single band that represents the NDGI value for each pixel.
ndgi_df = sedona.sql("""
SELECT
  RS_MapAlgebra(raster, 'D', 'out = ((rast[1] - rast[0]) / (rast[1] + rast[0]));')
AS raster
FROM neon
""")
ndgi_df.createOrReplaceTempView("ndgi")
We can confirm the NDGI values are in the expected range by using the RS_SummaryStats function which will return the count, sum, mean, standard deviation, minimum, and maximum values of a single band in the raster.
sedona.sql("SELECT RS_SummaryStats(raster) AS stats FROM ndgi").show(truncate=False)+----------------------------------------------------------------------------------------------------------------------+
|stats |
+----------------------------------------------------------------------------------------------------------------------+
|[1000000.0, -10863.97160595989, -0.010863971605958938, 0.045695423898689726, -0.1493212669683258, 0.18421052631578946]|
+----------------------------------------------------------------------------------------------------------------------+We can evaluate single pixel values using the RS_Value function. First, selecting a pixel from the upper left area of the image that visually appears to be dirt or gravel we can confirm the value is less than zero.
sedona.sql("""
SELECT RS_Value(raster, ST_SetSRID(ST_Point(470000, 7227880), 32606), 1)
AS pixel_value
FROM ndgi
""").show(truncate=False)
+--------------------+
|pixel_value |
+--------------------+
|-0.09956709956709957|
+--------------------+Next, choosing a pixel from the lower left area of the image that appears to be tree cover we can confirm the value is greater than zero.
sedona.sql("""
SELECT RS_Value(raster, ST_SetSRID(ST_Point(470700, 7228000), 32606), 1)
AS pixel_value
FROM ndgi
""").show(truncate=False)
+-------------------+
|pixel_value |
+-------------------+
|0.03636363636363636|
+-------------------+We can also export our new NDGI raster as a GeoTiff for further analysis, either directly in the Wherobots Notebook environment or to S3 using the RS_AsGeoTiff function. Here we save the raster as a GeoTiff in the notebook environment.
binary_raster_df = sedona.sql("SELECT RS_AsGeoTiff(raster) AS raster FROM ndgi")
binary_raster_df.write.format("raster").mode("overwrite").save("ndgi.tif")
Load Multiple Rasters
Previously we saw loading a single raster into a single row. In a typical workflow we work with many rasters across many rows. Let’s load a raster dataset from the WorldClim historical climate dataset of precipitation from 1970-2000. Each raster file represents the average precipitation across all observed years for each month of the year.
Instead of the RS_FromPath function we used previously to load the raster this time we’ll use the binary file reader to load each raster file, then use RS_FromGeoTiff to convert each row to a raster. We do this so we also have access to the file path which we’ll use to determine the month for each raster which is included in the filename.
PREC_URL = "s3://wherobots-examples/data/examples/world_clim/wc2.1_10m_prec" #/wc2.1_10m_prec_01.tif
rawDf = sedona.read.format("binaryFile").load(PREC_URL + "/*.tif")
rawDf.createOrReplaceTempView("rawdf")
We’ll use a regular expression to match on the file name and extract the month for each raster, which is the last two digits of the filename.
rasterDf = sedona.sql("""
SELECT
  RS_FromGeoTiff(content) AS raster,
  Int(regexp_extract(path, '(.*)([0-9]{2}).tif', 2)) AS month
FROM rawdf
""")

rasterDf.createOrReplaceTempView("prec")
rasterDf.printSchema()
root
|-- raster: raster (nullable = true)
|-- month: integer (nullable = true)To determine the average monthly precipitation for a certain location we can use the RS_Value function.
sedona.sql("""
SELECT
  month,
  RS_Value(raster, ST_POINT(-113.9940, 46.8721)) AS avg_prec
  FROM prec ORDER BY month ASC
""").show(truncate=False)
+-----+--------+
|month|avg_prec|
+-----+--------+
|1 |43.0 |
|2 |27.0 |
|3 |31.0 |
|4 |31.0 |
|5 |50.0 |
|6 |49.0 |
|7 |27.0 |
|8 |31.0 |
|9 |31.0 |
|10 |29.0 |
|11 |35.0 |
|12 |40.0 |
+-----+--------+
Zonal Statistics
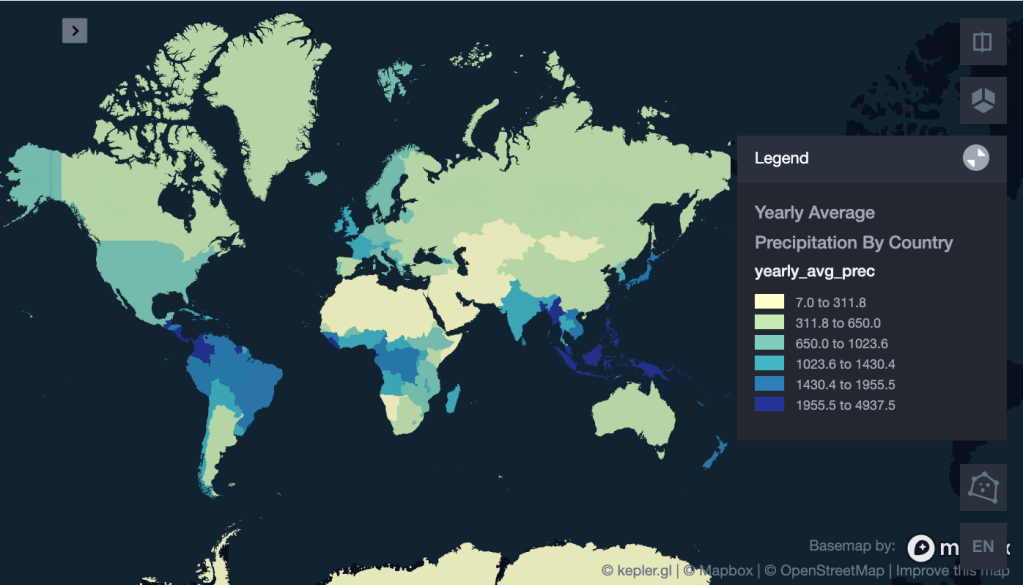
Zonal statistics involves joining vector geometries to the raster and calculating statistical or aggregating values based on the pixel values that fall within each vector geometry. Let’s load a dataset of country boundaries and calculate the average yearly precipitation for each country. To do this we’ll make use of the RS_ZonalStats function to compute the average of all precipitation values within each country’s boundaries.
Note that since the RS_ZonalStats function will return a value for each county for each month we will sum these monthly averages together to end up with the yearly average for each country.
world_prec_df = sedona.sql("""
SELECT
  sum(RS_ZonalStats(prec.raster, countries.geometry, 1, 'avg', true)) AS yearly_avg_prec,
  any_value(countries.geometry),
  countries.name
FROM prec, countries
GROUP BY name
ORDER BY yearly_avg_prec DESC
""")
world_prec_df.dropna().show()
+------------------+--------------------+--------------------+
| yearly_avg_prec| any_value(geometry)| name|
+------------------+--------------------+--------------------+
| 4937.5|MULTIPOLYGON (((1...| Micronesia|
| 3526.0|MULTIPOLYGON (((1...| Palau|
| 3378.75|MULTIPOLYGON (((-...| Samoa|
| 3345.6875|MULTIPOLYGON (((1...| Brunei|
| 3234.474358974358|MULTIPOLYGON (((1...| Solomon Is.|
| 3111.0|MULTIPOLYGON (((-...| Saint Helena|
| 3008.0|MULTIPOLYGON (((-...|Wallis and Futuna...|
|2988.5508720930234|MULTIPOLYGON (((1...| Papua New Guinea|
| 2934.628571428572|MULTIPOLYGON (((1...| Vanuatu|
| 2881.220250521921|MULTIPOLYGON (((1...| Malaysia|
|2831.0000000000005|MULTIPOLYGON (((-...| Costa Rica|
|2807.0000000000005|MULTIPOLYGON (((-...| Faeroe Is.|
| 2733.146385760997|MULTIPOLYGON (((1...| Indonesia|
|2717.5348837209303|MULTIPOLYGON (((-...| Sierra Leone|
| 2675.306306306307|MULTIPOLYGON (((-...| Panama|
|2656.3900709219856|POLYGON ((-11.476...| Liberia|
|2631.9744668068433|MULTIPOLYGON (((-...| Colombia|
|2560.3461538461534|MULTIPOLYGON (((-...| Fiji|
|2555.6666666666665|MULTIPOLYGON (((6...|São Tomé and Pr...|
|2525.6388261851025|MULTIPOLYGON (((1...| Philippines|
+------------------+--------------------+--------------------+
only showing top 20 rowsVisualizing the results of this zonal statistics analysis we can see that the countries with the highest average annual precipitation lie mostly along the equator.
Tiling Rasters
If we are working with large rasters we typically want to break them up into multiple tiles to improve the efficiency of raster operations. Let’s take a look at an example using a dataset from NOAA of night time visible lights. A single raster image represents the intensity of light visible at night across the entire surface of the Earth. There are several derived data products from this dataset that infer measures such as population or economic output, but we’ll use the average annual visible light for a single year.
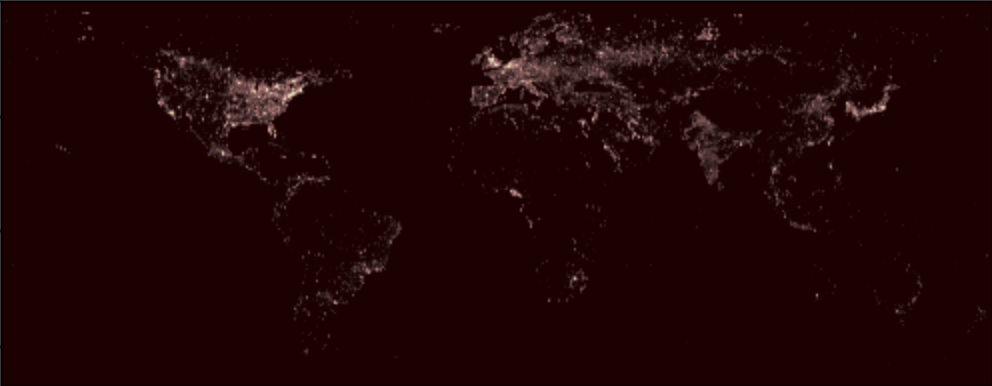
We can use the RS_FromPath function to load this raster into Sedona.
f10_1993_uri = "s3://wherobots-examples/data/examples/DMSP_OLS/F101993.v4b.global.stable_lights.avg_vis.tif"
f10_1993_df = sedona.sql(f"SELECT RS_FromPath('{f10_1993_uri}') AS raster")
f10_1993_df.createOrReplaceTempView("f10_1993")
This gives us a single row with a single raster. Let’s use the RS_TileExplode function to break our single large raster into equally sized tiles, with one tile per row.
tile_df = sedona.sql("SELECT RS_TileExplode(raster, 256, 256) AS (x, y, tile) FROM f10_1993")
tile_df.show(5)
+---+---+--------------------+
| x| y| tile|
+---+---+--------------------+
| 0| 0|OutDbGridCoverage...|
| 1| 0|OutDbGridCoverage...|
| 2| 0|OutDbGridCoverage...|
| 3| 0|OutDbGridCoverage...|
| 4| 0|OutDbGridCoverage...|
+---+---+--------------------+So far we’ve been querying our data as Sedona Spatial DataFrames, without persisting these DataFrames. However, to persist these tables we can save our DataFrames as Havasu Tables. Havasu is a spatial table format based on Apache Iceberg used by Sedona for storing geospatial data and enables efficient geospatial operations. You can read more about Havasu in this post.
By default in Wherobots Cloud the wherobots catalog is configured as a namespace for creating and storing databases that will be persisted in S3 cloud storage private to our Wherobots user.
Here we save our tiled raster table to a database called test_db in the wherobots catalog, thus the full name for this table is wherobots.test_db.f10_1993
sedona.sql("DROP TABLE IF EXISTS wherobots.test_db.f10_1993")
tile_df.writeTo("wherobots.test_db.f10_1993").create()
We can then refer to this table during queries. Here we count the number of rows in the table, which in this case is the number of tiles.
sedona.table("wherobots.test_db.f10_1993").count()
-----------------------
11154
To visualize the boundaries of each tile we can use SedonaKepler, along with the RS_Envelope function which will return the bounding box of each tile. Note that each tile also has x,y coordinates which represents its position relative to other tiles.
tiledMap = SedonaKepler.create_map()
SedonaKepler.add_df(tiledMap, sedona.table("wherobots.test_db.f10_1993").withColumn("tile", expr("RS_Envelope(tile)")), name="tiles")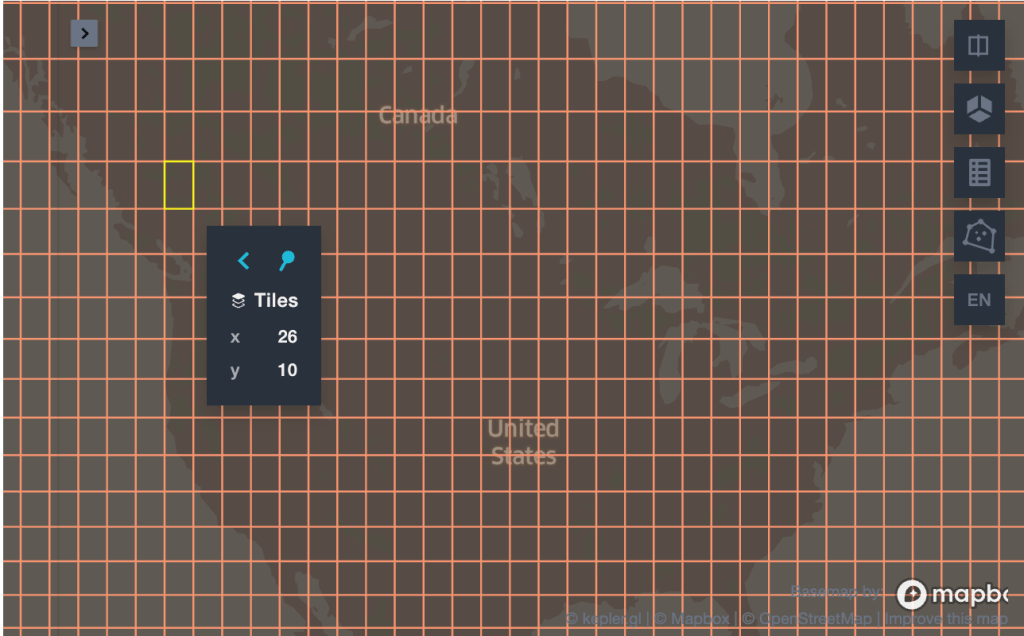
We can also visualize each individual tile using the RS_AsImage function.
display(HTML(sedona.table("wherobots.test_db.f10_1993").selectExpr("RS_AsImage(tile, 200)", "RS_Envelope(tile)").limit(5).toPandas().to_html(escape=False)))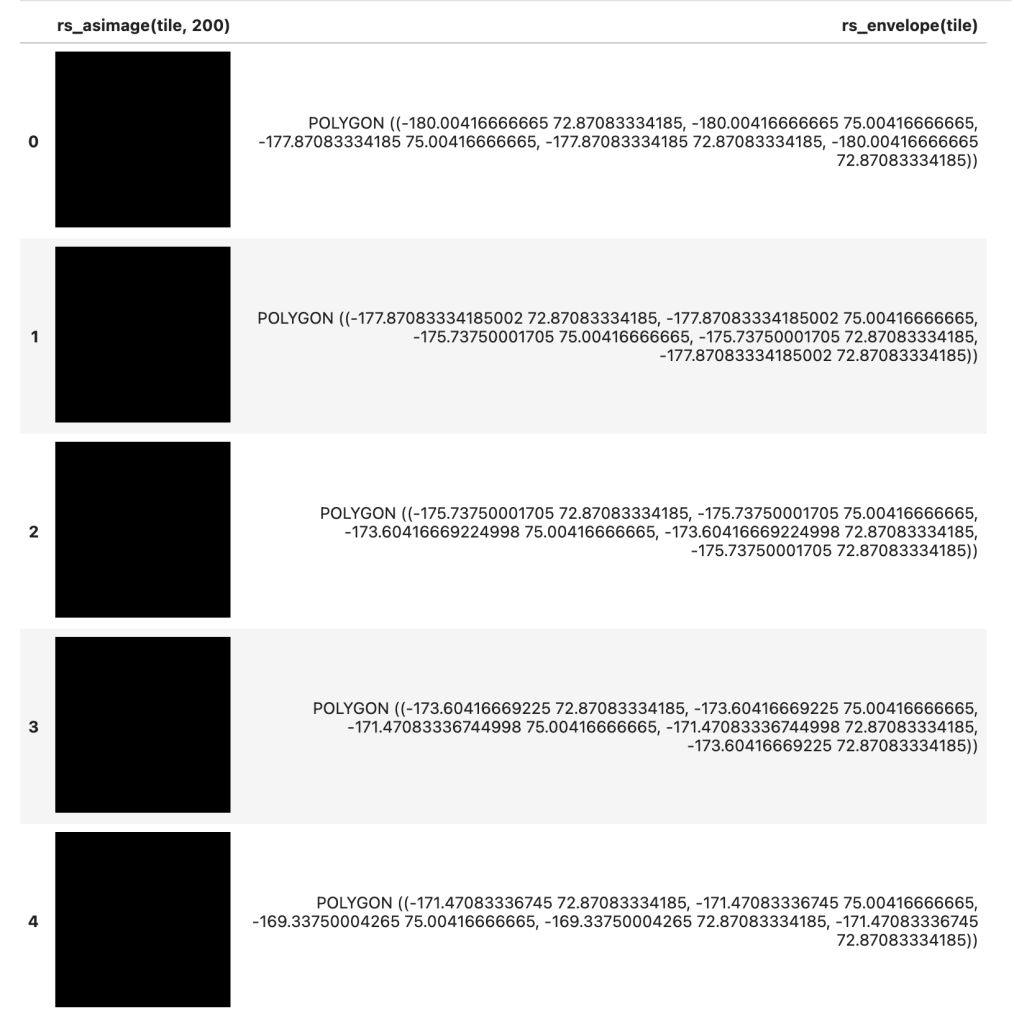
To inspect the observed light intensity at a certain point we first need to find the tile that contains the point we wish to inspect. We can do this using the RS_Intersects predicate to find intersecting vector and raster geometries.
sedona.sql("""
WITH matched_tile AS (
  SELECT * FROM wherobots.test_db.f10_1993
  WHERE RS_Intersects(tile, ST_POINT(-113.9940, 46.8721))
)

SELECT RS_Value(tile, ST_POINT(-113.9940, 46.8721))
AS pixel_value
FROM matched_tile

""").show(truncate=False)
+-----------+
|pixel_value|
+-----------+
|63.0 |
+-----------+Tiled Zonal Statistics
We can also perform zonal statistics operations on a tiled raster dataset. This time let’s determine which counties in the US have the most night time visible light.
First, we’ll load the boundaries of all US counties using a Shapefile from Natural Earth.
counties_shapefile = "s3://wherobots-examples/data/examples/natural_earth/ne_10m_admin_2_counties"
spatialRDD = ShapefileReader.readToGeometryRDD(sedona, counties_shapefile)
counties_df = Adapter.toDf(spatialRDD, sedona)
counties_df.createOrReplaceTempView("counties")
Similar to the zonal statistics example above we’ll use the RS_ZonalStats function to calculate statistics of pixel values from our raster for all pixels that are contained within a geometry, however since our raster is tiled we’ll first need to match the tile(s) that intersect with the boundary each of county.
county_light_tiled_df = sedona.sql("""
WITH matched_tile AS (
  SELECT tile, geometry, FIPS
  FROM wherobots.test_db.f10_1993, counties
  WHERE RS_Intersects(tile, counties.geometry)
)

SELECT
    sum(RS_ZonalStats(matched_tile.tile, matched_tile.geometry, 'mean')) AS mean_light,
    any_value(matched_tile.geometry) AS geometry,
    FIPS
FROM matched_tile
GROUP BY FIPS
""")

county_light_tiled_df.createOrReplaceTempView("county_light_1993")
county_light_tiled_df.show(100)
+--------------------+--------------------+-------+
| mean_light| geometry| FIPS|
+--------------------+--------------------+-------+
| 6.563388510224063|MULTIPOLYGON (((-...|US01003|
| 5.303058346553825|POLYGON ((-85.422...|US01019|
| 7.112594570538514|POLYGON ((-86.413...|US01021|
| 2.5223492723492806|POLYGON ((-88.091...|US01025|
| 9.564617731305812|POLYGON ((-85.789...|US01031|
| 13.433770014555993|POLYGON ((-88.130...|US01033|
| 8.240051020408188|POLYGON ((-86.370...|US01037|
| 2.301078582434537|POLYGON ((-86.191...|US01039|
| 0.9495387954422182|POLYGON ((-86.499...|US01041|
| 8.3112128146453|POLYGON ((-85.770...|US01045|
| 2.008212672420753|POLYGON ((-86.916...|US01047|
| 4.339487179487201|POLYGON ((-86.699...|US01053|Visualizing the results of this analysis we can see that night time visible light intensity is largely consistent with population centers. Further analysis of this data using time series analysis could reveal patterns of growth or resource extraction activities.
SedonaKepler.create_map(county_light_tiled_df, name="Night Time Visible Lights by County")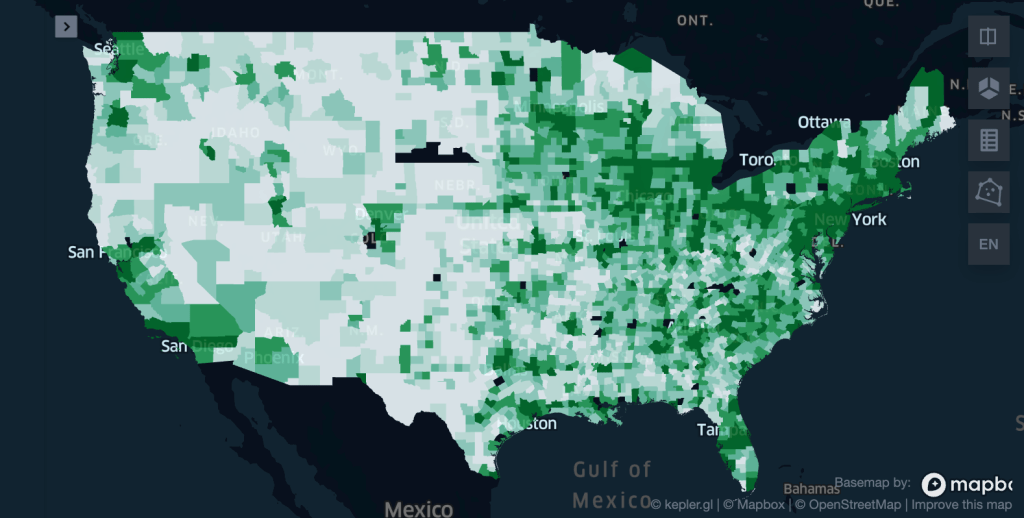
Resources
In this post we explored working with raster data in Apache Sedona and Wherobots Cloud. Here are some relevant resources that you might find helpful:
- Working with raster data Wherobots documentation
- Raster function reference documentation
- Jupyter notebook code on GitHub
- Insurance risk analysis example (using vector/raster joins)
- Wherobots open data raster datasets
Want to keep up with the latest developer news from the Wherobots and Apache Sedona community? Sign up for the This Month In Wherobots Newsletter:
Contributors
-
William Lyon
Developer Relations At Wherobots


